
On April 14th, we worked in our fifth „Refugee Datathon Munich“. We started a project that we had wanted to do for months: A global „Königssteiner Schlüssel“.
What is the „Königssteiner Schlüssel“?
Germany consists of 16 federal states. The „Königssteiner Schlüssel“ calculates a quota of how much every state has to contribute. In the asylum context this means: When the refugees arrive, they are distributed to the states according to the Königsstein Quota. When the Balkan route was open, most refugees arrived in Bavaria, but that didn’t mean that they stayed there.
The Königsstein Quota tells us how many new asylum seekers every state should take in, based on tax revenue and population.
Königsstein Quota =
    2/3*(proportion of tax revenue)
    + 1/3*(proportion of population)
„proportion“ here means: (number for this state) divided by (number for all states).
(Wikipedia.de: Königssteiner Schlüssel ; There’s no English version. It’s comparabel to the British Barnett Formula . „Königsstein“ is the name of the town where the agreement was signed.)
If we calculated this for all countries in the world, how would this compare to the actual intake of asylum seekers?
Global Data on Tax Revenue, Population and Asylum Seekers
Let’s have a look at the data sources.
The CIA yearbook
This is a good and established data source that provides all the relevant data. We struggled with the format, however. Our findings are documented here: https://github.com/muc-fluechtlingsrat/global-refugee-data/tree/master/cia-world-factbook . We definitely plan to extract that data in the future.
The United Nations High Council for Refugees (UNHCR)
This is another natural source for us, but again, we are still struggling with the data retrieval: https://github.com/muc-fluechtlingsrat/global-refugee-data/tree/master/unhcr . It’s definitely useful and another option that we’ll look into.
OECD data
The obvious issue with the OECD (Organisation for Economic Co-operation and Development) data is that it’s for the 35 OECD countries only. These are mostly rich market-oriented multi-party democracies. As a quick check:
- The total of new asylum requests to OECD countries in 2016 was 1.6 million
- OECD countries account for about 50% of the world’s GDP and 18% of the world population
- There were 10.3 million newly displaced persons in 2016 according to UNHCR
This suggests that OECD as a whole is heavily underperforming. Which is confirmed by UNHCR’s number: 84% of the displaced persons are hosted by developing regions.
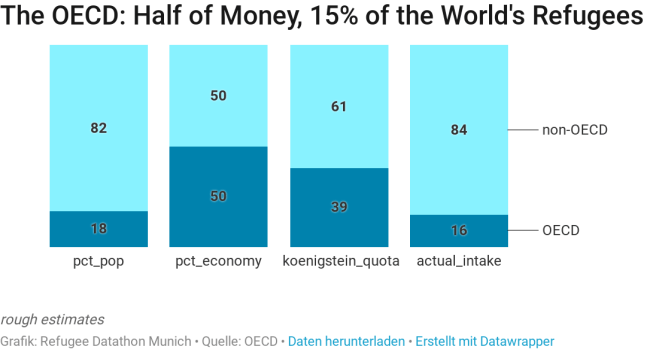
Still it’s a valid question to ask: Among the quite comparable OECD countries, which members should be taking in most refugees, and how many do they actually take in?
OECD Data has the data we need for our analysis:
- Tax Revenue
- Population (only until 2014, they recommend using UN Data)
- Migration
OECD wide „Königssteine Quota“ and Actual New Asylum Requests
Let’s first clarify some points, then jump into the results.
- This is for OECD countries only and doesn’t say anything about the fairness of world wide distribution (see above).
- The numbers for asylum seekers are from 2016. This was an unusual year, with a peak for Germany.
- The numbers for population and tax revenue are from 2011, which was the most recent year without gaps. This shouldn’t be a big issue, we don’t expect huge changes here. Also, the German Königsstein Schlüssel is calculated for the running year on the basis of data of two years before.
- There are obvious flaws in this approach, like how countries count asylum requests, and which other migration possibilities exists. This is not a final picture, but a starting point of a discussion. We hope that it’s still useful for new and surprising insights.
The data is on github. This is the „Big Picture“:
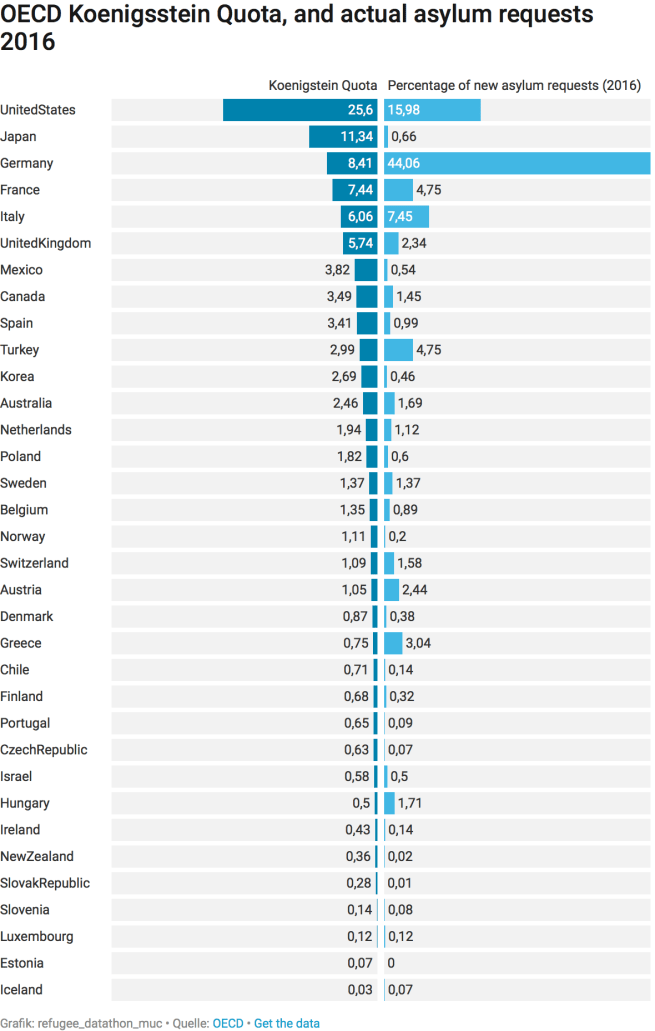
What does this mean?
Considering asylum seekers arriving in the OECD only – the OECD as a whole has an approximate index of 0.4, meaning that they took in less than half of their share.
- The U.S. should have taken about 25% percent. They took 16% only. We all know which direction Trump’s America is heading. Still they contributed most to UNHCR resettlement, with over 100,000 submissions. These could be added to the 260.000 asylum seekers, which would still be below their quota.
- Japan underperforms even more dramatically. The situation is embarrassing, even ridiculous. For some background see e.g. this article in the Guardian. Kudos to the pro refugee activists in Japan. Their struggle must be really hard.
- If you wonder about Korea, you can see that it’s hardly better. A nod to the activists there, too – they obviously love data as much we do.
- Germany was heavily overperforming in 2016. In absolute numbers, 722’000 refugees arrived. Good job.
- France was underperforming, not so much fraternity really. We all remember the Calais Jungle.
- Italy was slightly overperforming by official numbers, and probably more so by actual numbers. Its treatment of refugees is known to be below standards, though. I think this applies to many overperforming countries along the Balkan route.
- United Kingdom – what happened to this proud defender of human rights? There was public support for refugees, and some political response, but the numbers disappoint (article in the Guardian).
- On many countries I’m lacking the background – contributions are welcome.
A New Indicator: The „Königsstein contribution index“
Let’s define a new „Königsstein contribution index“: The actual intake in percent, divided by the Königsstein Quota. This is an indicator of if a country did more than their fair share – contribution index > 1, or less. This is all in relation of the OECD countries.
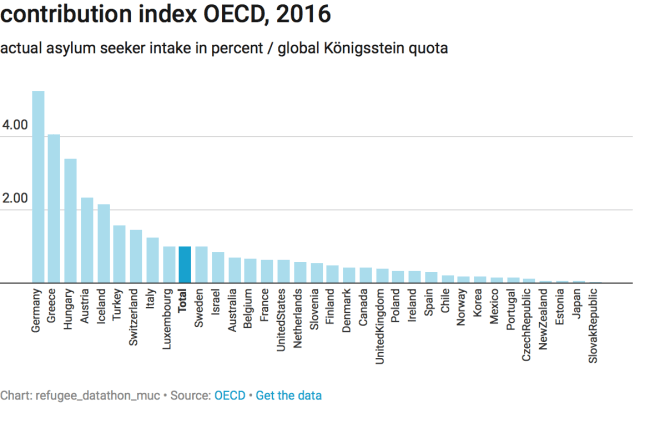 Countries left of „Total“ contributed more than their „Königsstein Quota“ share.
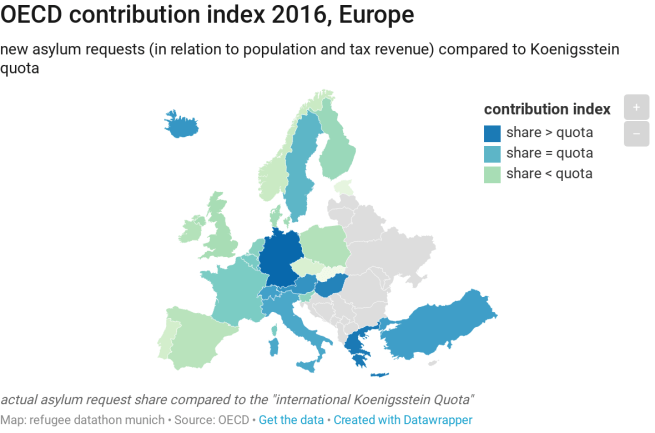
For those who love maps: It’s clearly visible that the countries along the Balkan route received more asylum requests (well, there’s Island … in every statistic one country stands out, and most of the time it’s Island.)
https://datawrapper.dwcdn.net/0pxzf/2/
Conclusion
The OECD countries as a whole are not contributing enough in relation to their share of the world population and economic strength. Within the OECD, there obviously is no solidarity, and it doesn’t look like there was a strategy. Asia doesn’t seem to have started thinking about global responsibility.
What next?
This is the result of a day-long datathon, and there is so much further investigation we’d like to dive in, such as
- Do the same analysis for years other than 2016
- Find out more about the refugee policy of the countries
- Do the world wide comparison
- Draw a map
